Geographic Focus
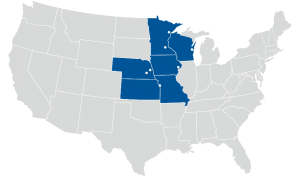
SR Realty Trust will invest in commercial real estate assets located in major metropolitan areas across the Upper Midwest.
The portfolio is currently composed of assets in Minnesota (Minneapolis-Saint Paul, Duluth), Missouri (Kansas City), Nebraska (Omaha, Lincoln), Iowa (Quad Cities), and Wisconsin (Milwaukee).

Portfolio Highlights
Portfolio Highlights as of December 2022
| Portfolio Value | $446,000,000+ |
| Number of Properties | 42 |
| Investments | 5 |
| Total Square Feet | 4,100,000+ |
| Loan-to-Value | 55% |
Share History
Annual Volume and Price History
| Year | # of Shares Outstanding | # of Units Outstanding | Total # of Shares & Units Outstanding | Price |
| 2014 | 186,667 | 0 | 186,667 | $9.00 |
| 2015 | 334,118 | 1,801,791 | 2,135,909 | $10.00 |
| 2016 | 571,903 | 2,077,380 | 2,649,283 | $10.75 |
| 2017 | 1,013,147 | 3,038,316 | 4,051,463 | $11.65 |
| 2018 | 1,274,121 | 3,215,178 | 4,489,299 | $12.00 |
| 2019 | 1,604,899 | 3,853,125 | 5,458,024 | $12.50 |
| 2020 | 1,736,451 | 5,213,070 | 6,949,521 | $12.50 |
| 2021 | 1,861,205 | 5,516,303 | 7,377,508 | $13.50 |
| 2022 | 2,313,581 | 7,663,778 | 9,977,359 | $14.75 |
Key Financial Metrics
Key Financial Metrics(1)
| Year ended December 31 (Rounded to the 000s except per share amounts) |
2020 | 2021 | 2022 |
| Rental Revenue | $17,338,000 | $21,906,000 | $24,271,000 |
| Property NOI, | $10,501,000 | $12,603,000 | $14,094,000 |
| Dividends Per Share(2) | $0.53 | $0.72 | $0.72 |
| Funds from Operations(3) | $4,057,000 | $3,578,000 | $4,389,000 |
| FFO Per Share | $0.71 | $0.50 | $0.52 |
| FFO Payout Ratio | 75% | 144% | 139% |
| Adjusted Funds From Operations(4) | $4,115,000 | $987,000 | $1,706,000 |
| AFFO Per Share | $0.72 | $0.14 | $0.20 |
| AFFO Payout Ratio | 73% | 514% | 359% |
| Interest Coverage Ratio | 2.7 X | 2.2 X | 2.3 X |
| Loan-To-Value Ratio | 56% | 54% | 55% |
| Weighted Average Shares/Units Outstanding | 5,748,000 | 7,133,000 | 8,497,000 |
| NOTES: (1) Shares and per share amounts include both REIT shares and operating partnership units. (2) Dividends Per Share is the annual total. (3) FFO is equal to net income, excluding gains or losses from sale of property, and adding back non-cash expenses such as depreciation and amortization. (4) AFFO is calculated by subtracting from FFO normalized recurring capital expenditures and miscellaneous non-cash charges. |
|||

